ChatBot:在 Slack 中使用监控和告警
前面文章中我们使用 Errbot 通过 Kubernetes API 在 Slack 中进行 Kubernetes 查询。这种方式很局限。毕竟拉更多组件下水,写更多代码才是大势所趋 LOL。本文以 Istio 中的响应时间监控为例,看看 Errbot 和 Prometheus 的互动。
前提
- Istio
- Prometheus
- 公网部署
- 接入 Slack 的 Errbot
- Errbot 开放 3141 端口,能够被 Alertmanager 使用。
注意:
- 这里只是介绍一下这种思路,例子要求比较高,源文件也不会很完整。要投入实际使用,需要更多配合。
- 选择 Istio 做监控目标,只是因为目前环境方便,并无特殊含义。
- Errbot 的 Slack 接入在之前的文章有一些介绍可以参考。
在 Bot 中获取监控指标
Prometheus 提供了很方便的 HTTP API(注 1),简单的使用 HTTP 客户端即可获取。下面的表达式用于从 Istio 中获取响应时间的 p99 指标:
    histogram_quantile(0.99,
    sum(irate(istio_request_duration_bucket[1m]))
    by (source_service, source_version,
    destination_service, destination_version, le))
这里为行文方便,直接硬编码,实际上可以通过查询模板、Bot 参数等方式,获得更灵活的查询。或者更加简单粗暴的,在聊天室向 Bot 提供查询公式直接查询。
下面的代码,会将 Prometheus 中的指标,在 Slack 中以卡片的方式输出到指定聊天室中。
- 指定一个
query参数,取值为刚才提到的 Prometheus 查询语句,{"query": prom}的形式进行 URL Encode。 - API 指令发出后,Prometheus 会响应一段 JSON 报文,报文的
result字段包含一个列表,包含了各个服务的各个版本之间的通信响应时间。 - 这里使用 Errbot 的 send_card(注 2)功能,通过 Field 方式逐个输出服务记录。
room = self.build_identifier("#bot"),使用 self.build_identifier(注 3)设置发送目标。- 代码放入 Errbot 插件之后,私聊窗口输入
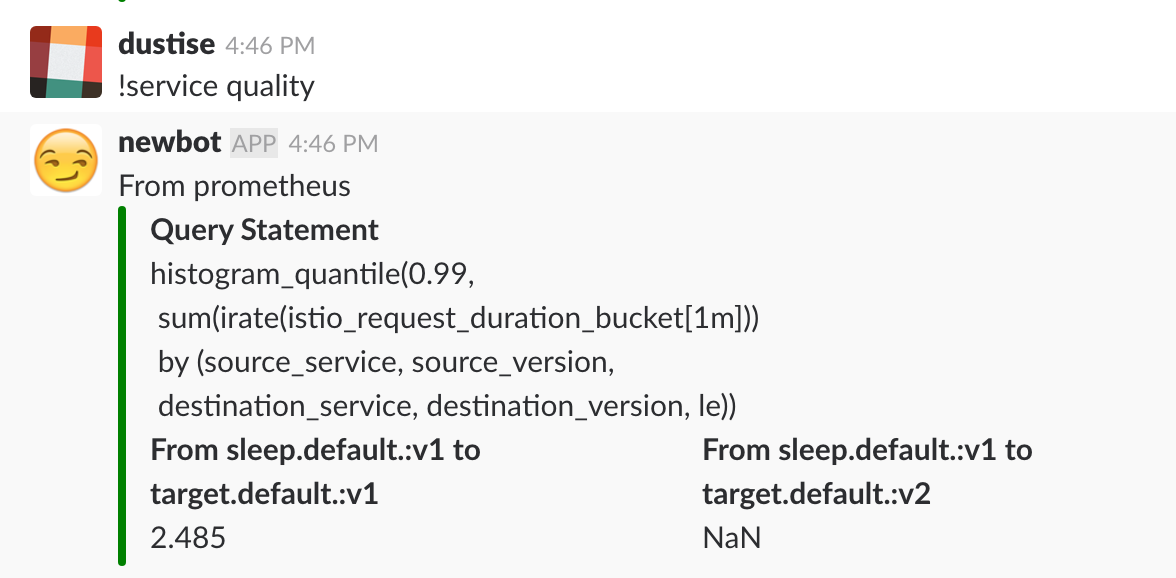
!restart,重启。会看到 Errbot 发出重启信息之后断线。 - 等 Errbot 再次在线,在聊天室输入指令
!service quality,会看到类似如下的信息回应:
使用 Bot 接收 Prometheus 告警
实际上 Prometheus 的 Alert Manager 提供了到 Slack 的集成,这里纯属演示,绕了个远。
配置 Bot
- 在聊天室私信中发布命令
!plugin config Webserver {'HOST': '0.0.0.0','PORT': 3141},要求 Errbot 开放端口启动 Webhook 服务。 同样的使用私信发送命令
!status,查询插件运行状态,可以看到Webserver已经启动。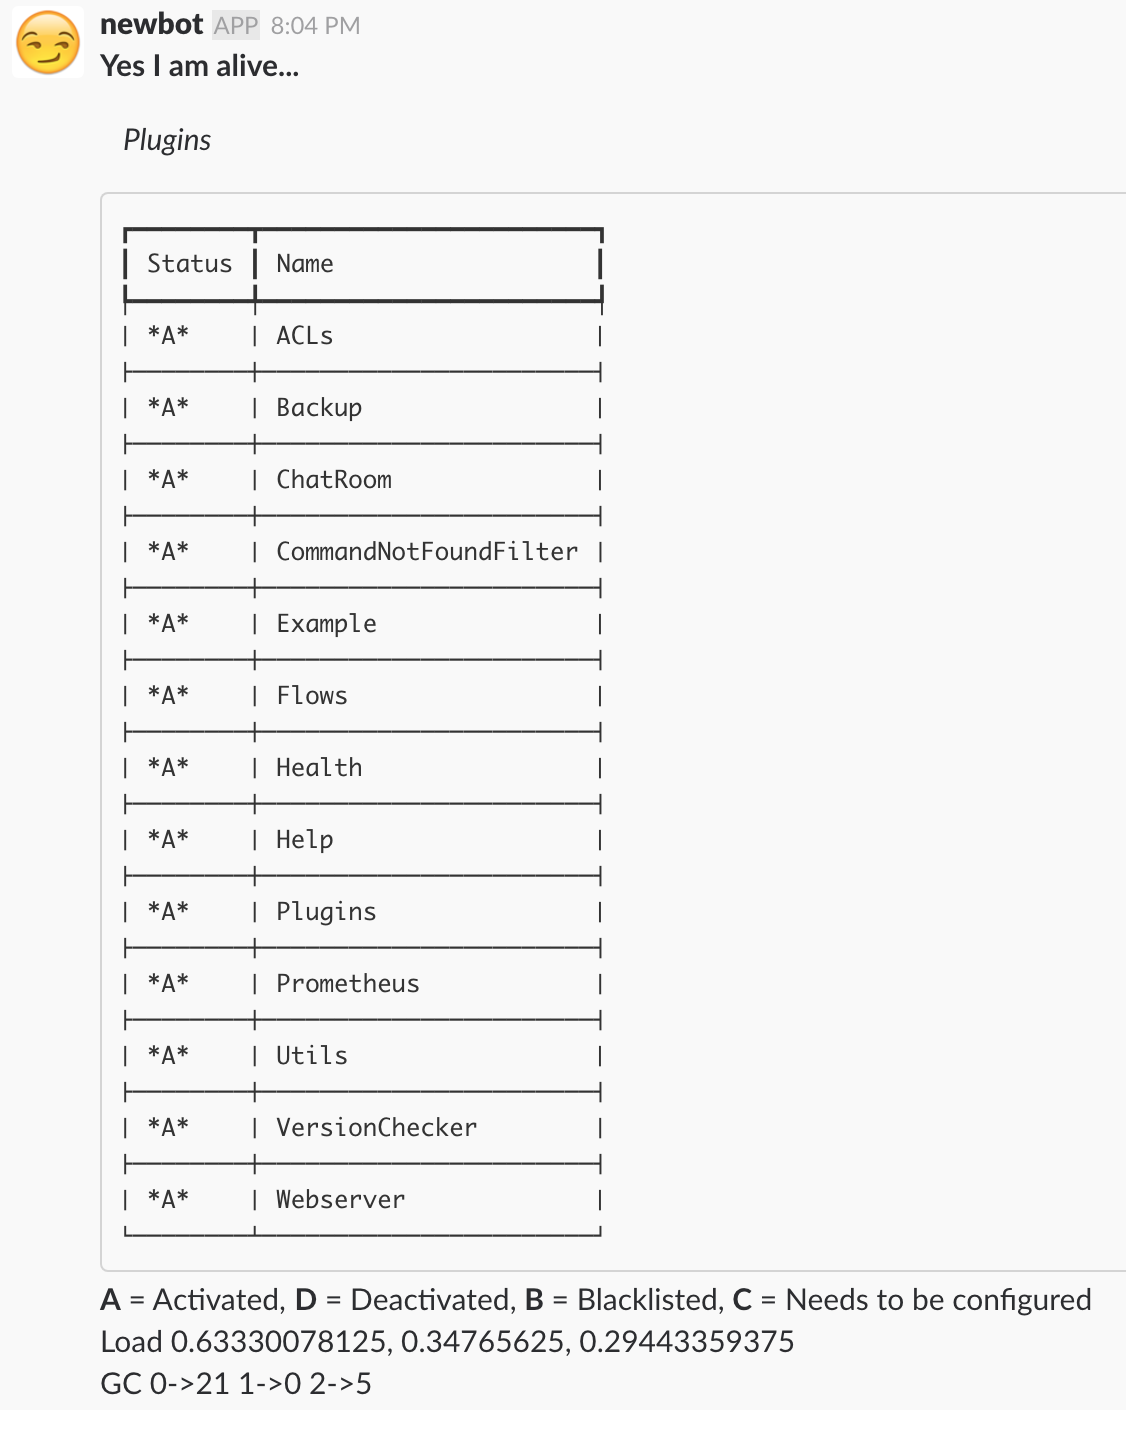
为 Bot 插件加入 Webhook 代码,并重新启动 Bot,这里定义了路径
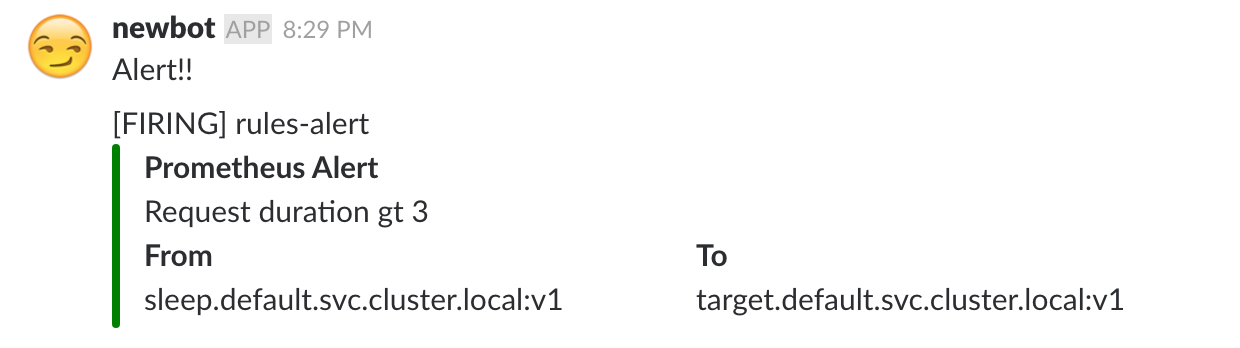
alertmanager用于接受告警,同样使用卡片方式,发送告警信息到bot频道,在卡片中显示告警的相关服务及其版本:def alertmanager(self, data): """Webhook for alerts from Prometheus""" target = self.build_identifier("#bot") self.send(target, "Alert!!") for alert in data['alerts']: self.send_card( to=target, summary='[{}] {}'.format( data['status'].upper(), data['commonLabels']['alertname'] ), title="Prometheus Alert", fields=[('From', alert['annotations']['from']), ('To', alert['annotations']['to'])], body=alert['annotations']['summary'] )
Prometheus 配置
配置 Prometheus 告警规则:
- 使用前面提到的同一个公式
- 使用注解来传递应用标签
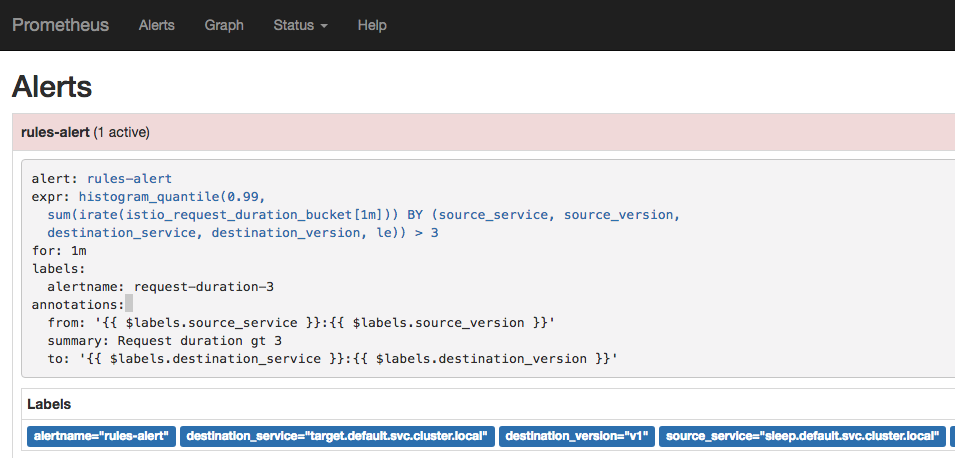
这里我们配置大于 3 秒钟的耗时发生告警
groups:
- name: fake
rules:
- alert: rules-alert
expr: |
    histogram_quantile(0.99,
    sum(irate(istio_request_duration_bucket[1m]))
    by (source_service, source_version,
    destination_service, destination_version, le)) > 3
for: 1m
labels:
    alertname: "request-duration-3"
annotations:
    summary: "Request duration gt 3"
    from: "{{ $labels.source_service }}:{{ $labels.source_version }}"
    to: "{{ $labels.destination_service }}:{{ $labels.destination_version }}"
配置和重启 Alert Manager,定义使用 Web hook 通知 errbot 发送告警到 Slack:
route:
    receiver: 'webhook'
    group_wait: 30s
    group_interval: 5m
    repeat_interval: 4h
    group_by: ['from', 'to']
    routes:

receivers:
- name: 'webhook'
    webhook_configs:
    - url: "http://errbot.default:3141/alertmanager"
Prometheus 连接到 AlertManager 上,用于发送告警,修改后重启 Prometheus:
alerting:
alertmanagers:
- scheme: http
  static_configs:
  - targets:
    - "alertmanager:9093"
运行
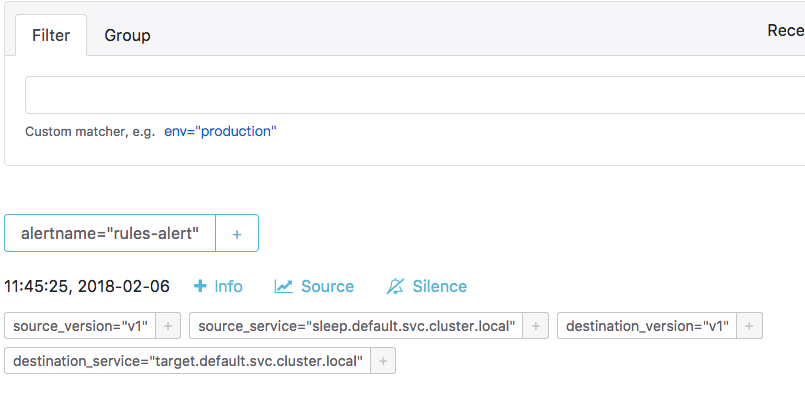
在负载上调用耗时操作,例如持续访问httpbin的/delay/5指令,满足标准后,可以看到,告警的传递线路:
注
https://prometheus.io/docs/prometheus/latest/querying/api/http://errbot.io/en/latest/errbot.botplugin.html#errbot.botplugin.BotPlugin.send_cardhttp://errbot.io/en/latest/errbot.botplugin.html#errbot.botplugin.BotPlugin.build_identifier
附录
查询
@botcmd
def service_quality(self, message, args):
url = "http://prometheus-server.kube-system/api/v1/query?"
prom = """
histogram_quantile(0.99,
sum(irate(istio_request_duration_bucket[1m]))
by (source_service, source_version,
destination_service, destination_version, le))
"""
query = {"query": prom}
query = urlencode(query)
f = urllib.request.urlopen(url + query)
resp = f.read()
record_list = json.loads(resp)
room = self.build_identifier("#bot")
field_list = []
for record in record_list["data"]["result"]:
    metric = record["metric"]
    value = record["value"]
    domain = ".svc.cluster.local"
    field = ("From {}:{} to {}:{}".format(
        metric["source_service"].replace(domain, ""),
        metric["source_version"],
        metric["destination_service"].replace(domain, ""),
        metric["destination_version"],
    ), value[-1])
    field_list.append(field)
self.send_card(to=room, body=prom,
               title="Query Statement", summary="From prometheus",
               color="green", fields=field_list)
崔秀龙
简单,是大师的责任;我们凡夫俗子,能做到清楚就很不容易了。